India’s private capital market has grown to a scale that spreadsheets struggle to keep up with. SEBI data shows AIF commitments of ₹17.5 lakh crore as of June 30, 2026, of which about 43% had been drawn from investors.
Startup funding kept growing as well. Bain & Company and IVCA put India’s VC deal value at roughly $16 billion in 2025. India’s family offices rose from about 45 in 2018 to roughly 300 by 2024.
Investment positions across all three investor types can change between reporting dates. This guide sets out what each type of investor should track, and the working method that keeps those numbers current.
Quick answer
Portfolio monitoring means checking, on a fixed cycle, how each holding in an investment portfolio performs. Investors gather financial and operating data and compare it with plans and benchmarks. They then use the result to move reserves or change exit plans.
What is portfolio monitoring?
Portfolio monitoring is the continuous review of every position an investor holds, from first check to exit. It turns scattered company updates and valuation reports into a consolidated view that decision-makers can trust.
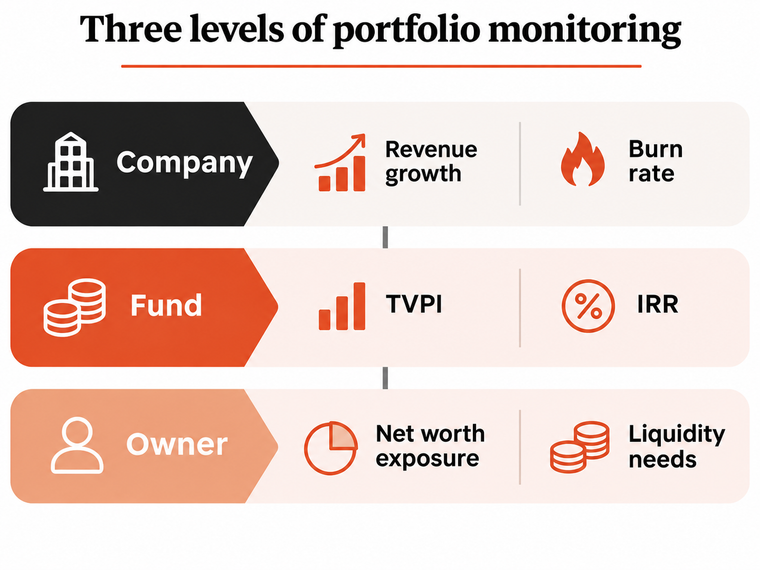
The work runs at three levels. Company monitoring follows each investee’s revenue and cash, while fund monitoring rolls those positions into returns for limited partners (LPs). Owner-level monitoring, common in family offices, adds every asset and liability the family holds.
Deciding what to buy or sell is portfolio management. Monitoring supplies the evidence for those calls, and fund administration books the resulting cash flows and statements.
What should VCs, AIFs and family offices track?
Each investor type focuses on different priorities, so the metrics vary by investment vehicle. The table below maps the main measures and outputs for each.
| Investor type | Core metrics and focus areas | Main outputs |
|---|---|---|
| VC firms | Revenue growth, burn rate, cash runway, gross margin, CAC, retention and churn, cap table changes | Quarterly KPI dashboards, board packs, reserve models, PME benchmarking |
| AIFs | NAV, capital calls, distributions, DPI, TVPI, IRR, SEBI compliance, ESG parameters | LP statements, fund performance reports, regulatory filings |
| Family offices | Consolidated net worth, exposure across PMS, AIF and direct equity, cash and liquidity, concentration, duplicate holdings | Consolidated multi-asset reports, liability and commitment schedules |
1. VC firms: Company health and ownership
Early-stage companies evolve quickly, so VC firms prioritise operating metrics. Revenue growth and gross margin show whether a company is meeting its targets, while burn rate indicates how long its cash will last.
Customer acquisition cost (CAC) and churn reveal whether growth will hold up. Cap table events carry equal weight, since a down round or an ESOP pool top-up changes the fund’s ownership and its mark. Our guide to cap table management covers how those records stay accurate.
These inputs feed quarterly KPI dashboards and board packs. Reserve models use the same inputs to determine how much follow-on capital to allocate to each company.
2. AIFs: NAV and investor reporting
An AIF must report to both investors and SEBI, which expands its monitoring requirements. Net asset value (NAV) shows what the scheme is worth, while capital calls and distributions record cash moving in and out.
Return multiples and IRR translate those flows into performance. Compliance requirements also include valuation schedules and benchmarking data. ESG parameters also apply where investors require them.
3. Family offices: Consolidated net worth
Family office reporting spans multiple asset classes, with consolidated net worth serving as the primary metric. Net worth here means total assets minus loans and guarantees.
Holdings are often spread across multiple PMS managers and AIFs. Direct startup stakes then add positions with no daily price, which makes liquidity and duplicate exposure the main concerns.
Which return metrics show how a fund is performing?
Fund performance needs several metrics read side by side, because each answers a different question. Internal rate of return (IRR) gives an annualised return that accounts for the timing of every cash flow.
Multiples fill in the rest. Distributions to paid-in capital (DPI) counts cash already returned, and residual value to paid-in capital (RVPI) counts unrealised value. Total value to paid-in capital (TVPI) adds the two, while multiple on invested capital (MOIC) is usually quoted gross at deal level.
Here’s how DPI, RVPI, and TVPI work together in a hypothetical fund that has received ₹80 crore in investor capital.
| Item | Amount or result |
|---|---|
| Capital paid in by investors | ₹80 crore |
| Distributions paid to investors | ₹20 crore |
| Residual value of holdings | ₹96 crore |
| DPI (₹20 crore ÷ ₹80 crore) | 0.25x |
| RVPI (₹96 crore ÷ ₹80 crore) | 1.20x |
| TVPI (DPI + RVPI) | 1.45x |
In this example, a TVPI of 1.45x looks healthy, though only 0.25x has reached investors as cash. LPs in a seven-year-old fund weigh that DPI figure heavily, since unrealised value depends on marks.
Public market equivalent (PME) analysis adds a further test. It replays the fund’s cash flows into an index such as the Nifty 50 and asks whether the fund beat that alternative.
Peer comparison completes the set. Indian AIFs report data to SEBI-recognised benchmarking agencies, which rank each fund against others in its category and vintage.
How does the portfolio monitoring workflow run?
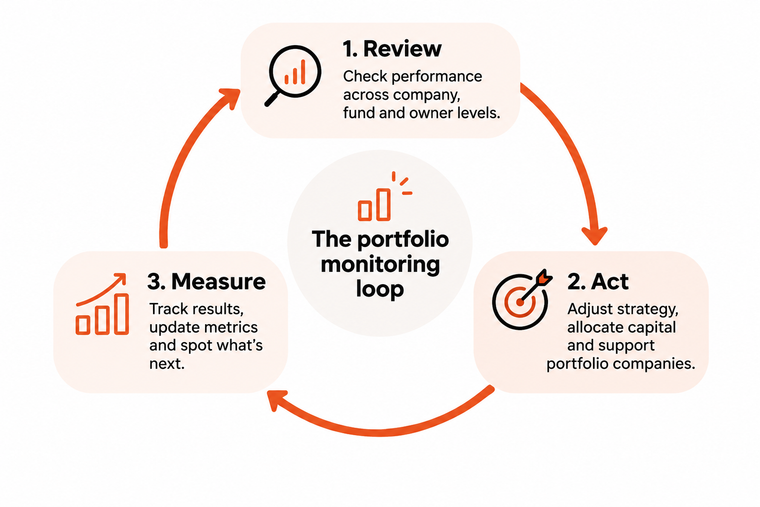
Monitoring runs as a loop of three stages that repeats every month or quarter. Every cycle ends with decisions, and the next one checks whether they worked.
1. Collect and standardise the data
Investee companies and outside managers send numbers on their own timetables. One founder shares a monthly MIS, and another sends audited Ind AS statements months after the March year end.
Metric definitions vary just as widely. Company A may count ARR from signed contracts, while Company B multiplies the latest monthly revenue by 12. Both figures carry the same label and measure different things.
Standardisation starts with a data dictionary and a fixed request template. Automated intake, or one shared spreadsheet format, then makes each new submission comparable on arrival.
Write the metric dictionary first
Agree on one definition per metric before you collect a single number. For ARR, state whether it uses contracted or recognised revenue. Also record how discounts are treated and when a churned customer leaves the count.
2. Analyse performance and risk
At company level, actuals go against the approved budget and the company’s own past quarters. Peer sets add a third lens, because SaaS companies face ARR growth and revenue multiples while consumer brands face repeat purchase and shelf velocity.
At fund level, the same data rolls up into IRR and TVPI, along with a portfolio-wide view of cash runway. Valuation inputs need care here, because each mark flows straight into NAV.
Analysts should record why each number moved. A runway cut by a planned hiring push needs a different response from one cut by slower collections.
3. Review and act on a set cadence
Results go to the investment committee (IC) or the family board on a fixed monthly or quarterly rhythm. Regular slots keep hard conversations on the calendar and out of crisis meetings.
Outliers should surface early, in both directions. The table below shows sample triggers that turn a data point into a specific action.
| Signal | Example trigger | Typical response |
|---|---|---|
| Cash runway | Under nine months, with no round in progress | Bridge discussion and a reserve review |
| Revenue against plan | Two quarters below 80% of budget | Founder deep dive, operating support and a revised exit timeline |
| Customer retention | Churn rising for two straight quarters | Review of pricing and growth assumptions |
| Cap table | Round priced below the last one, or a pool top-up | Recalculate ownership, mark and pro rata decision |
| Reporting discipline | Two missed data deadlines | Board nominee raises it at the next board meeting |
Strong performers deserve the same attention. When a company runs far ahead of plan, it may justify a larger follow-on or an earlier exit. An exit waterfall then shows what each sale price returns to the fund after liquidation preferences.
How do SEBI rules shape monitoring for Indian AIFs?
SEBI sets part of the monitoring calendar for every registered AIF. Category I and II funds need an independent valuation of investments at least once every six months. With approval from investors holding 75% by value, the cycle can stretch to a year.
Performance data follows a similar rhythm. Once an AIF passes one year from first close, it sends cash flow and valuation data to benchmarking agencies twice a year. Agencies appointed through IVCA include CRISIL and Preqin.
Activity reporting changed in 2026. SEBI’s circular dated March 4, 2026 introduced a comprehensive annual activity report and a shorter quarterly report.
Fixed dates on an AIF calendar
Quarterly: Limited Quarterly Activity Report within 15 calendar days of quarter end.
Annually: Comprehensive Annual Activity Report within 30 calendar days of 31 March.
Half-yearly: Independent valuation for Category I and II funds, unless investors approve a yearly cycle.
Half-yearly: Benchmarking figures dated 30 September and 31 March.
Funds with global LPs commonly adopt the ILPA Reporting Template too. Version 2.0, released in January 2025, covers funds still investing in Q1 2026 or launched from January 1, 2026.
Why is monitoring harder for family offices?
Family offices deal with more data sources and fewer shared formats than funds do. Statements arrive from custodians and fund managers, each on its own schedule and valuation basis. Startup holdings add a third format through investor updates.
Valuation dates rarely line up. PMS accounts are priced daily, while an AIF unit may carry a mark several months old.
Uncalled commitments raise a liquidity question. Suppose a family has committed ₹10 crore to an AIF and ₹4 crore has been drawn, leaving ₹6 crore to keep ready for future calls.
Look-through exposure is the hardest test. Say a family backs a fintech company directly and also holds units in two AIFs that own it. Consolidated reporting adds those three slices together to show real concentration, then nets every asset against loans.
Which tools support portfolio monitoring?
Three broad groups of tools serve portfolio monitoring, and larger investors often combine these categories:
- All-in-one and fund administration platforms: Carta and Visible.vc belong here, as do Vestberry and Folio. They centralize data intake and cap tables, along with capital calls and LP reporting.
- Institutional analytics and AI parsing: Chronograph and Cobalt handle heavy private-markets reconciliation, and AI parsers extract figures from investor updates.
- Family office consolidation: Multi-asset platforms pull private credit and real estate into one net-worth dashboard, alongside PMS accounts and business holdings.
Test any shortlisted tool on your own data before you sign. Ask it to load one messy quarter, apply a down round and produce an investor report from the result.
How can Hissa support portfolio monitoring?
Hissa portfolio management gives family offices and funds a centralised view of their private market investments. More than 200 investors and funds use Hissa to track their portfolios.
The platform supports portfolio monitoring through the following capabilities:
- Investment records: Track investments and instruments in one dashboard.
- Live valuations: Automatically update position values when a board approves a new funding round.
- Ownership tracking: Monitor changes in holding percentages and dilution after each funding round.
- Performance analysis: Compare MOIC and IRR across industries and investment sizes.
- Watchlists: Keep updates on potential investment opportunities in one place.
- Exit planning: Model different exit scenarios to inform portfolio decisions.
Hissa also offers a term sheet generator to create and issue term sheets for new investments.
Effective portfolio monitoring goes beyond tracking numbers. Investors need consistent metrics and predefined triggers to make informed decisions about reserves, follow-on investments, and exits. Hissa brings the relevant investment data together to support these reviews.
Book a demo to see how Hissa helps you monitor private holdings and returns, or explore its solutions for investors.